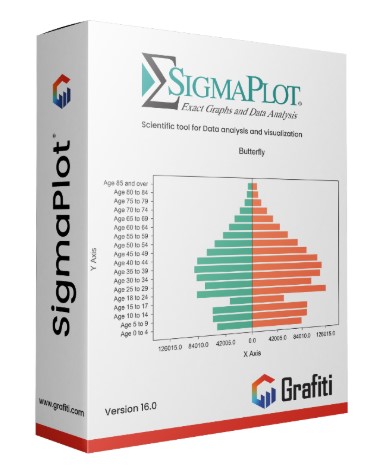
SigmaPlot v16 科學繪圖軟體

- SigmaPlot v16 科學繪圖軟體
-
類別繪圖應用軟體
-
介紹SigmaPlot是一套學術性的繪圖軟體,可將實驗的data繪製成圖形來呈現,由於該軟體所繪製的圖形,其可供修改的選項十分彈性,因此常被拿來呈現實驗的數據
SigmaPlot 科學繪圖軟體
New Graph Features
• Arrows with solid arrowheads
• Added a right mouse menu command for pasting copied
graph primitives (arrow, box, etc.) on the page
• A common operation on a graph is to zoom in, make a
modification and then zoom out. A toggle was added, Ctrl+3,
between your current zoom level and 100%.
• Data sampling dropdown now shows the maximum number
of rows in the column
• Mini-toolbars for left mouse selection may be turned off
• An Anti-aliasing button has been added to the Graph Page Tab,
Format Group
• Improved user interface for the Color Schemes dialog
• The “Each Curve” option is automatically turned on when perfo
rming a linear regression on one plot
• Additional Plot Regression Statistics
• Improved access to result graphs following statistical analysis –
obtained by right clicking either a statistical report or another
result graph
• The scatter matrix graph, used to display results of some
statistical tests such as correlation, has increased support from
10 variables previously up to 40 variables
• Graph Properties can now be obtained by right clicking a
graph or plot
• Renamed the Linear Regression command in the Graph
Analysis group of the Analysis tab to Plot Regression
• Text and special symbols options are now shown directly on
the symbols dialog
• The Graph Additions Group Name has been changed to
Manage Plots
• Multiple Result Graph Types May Now Be Simultaneously
Selected from the Create Result Graph Dialog
• The default appearance of all Result Graphs has been improved
• Added TIFF gray scale export option for graphs and graph
pages
• A Page Templates button has been added to the Format
group of the Graph Page ribbon tab
New Worksheet Features
• Sorting data in the worksheet now supports multiple key
columns
• Coefficient of Variation and 90% Confidence Interval added
to Column Statistics
• Formatted text can now be used in statistical analyses
• Custom Column Statistics Items and Order May Now
be Specified
• Statistical procedures may now use data from over 4000
worksheet columns
New Analysis Features
• The One-Way Frequency Tables method has been added
• The unpaired (aka 2-independent samples) t-test has been
enhanced to provide options to test the equality of the
populations means of the two groups without assuming
equal variances (Welch’s t-test)
• Ctrl-A now selects all program lines in user defined transforms
• More nonlinear regression application examples have been
added that can now be accessed from the Help menu
• Improvements to the transforms examples that can now be
accessed from the Help menu
• Improvements to some ape (automatic parameter estimate)
functions in the Transform Language
• The number of groups for computing dummy variables has
been extended from 100 to 1000
• Increased the maximum character length of labels in statistical tables from 30 to 255
• Error Message and Partial Save Nonlinear Regression Improve ments
• The User-Defined Transform and Regression Dialogs are Now Resizable and can be Saved
• Improved User Interface for the Quick Transforms dialog
New Miscellaneous Features
• Unicode is now supported
• Automatic Updating is available within SigmaPlot to
get the latest updates to features
• User settings are now preserved for new versions of SigmaPlot
• Added new ribbon layouts for different types of workflows
• The Export button is also on the Main button
• New Macro Method for Exporting any Graph Page Selection
• Added a Save All command to the Main Button
• Two New Macros Using Indexed Data for Graphing
• Sample Data Sets Available from Help
• New Macro Automation Method to Determine a Worksheet
Column Length
• Added File Import and Import Database to the Main Button
panel for more visible access
• Data Can Now be Extracted from a Result Graph
Please click me for v16 detailed specifications

System Requirements
Windows 7, Windows 8.x and Windows 10, Windows Vista:
• 2 GHz 32-bit (x86) or 64-bit (x64) Processor
• 2 GB of System Memory for 32-bit (x86)
• 4 GB of System Memory for 64-bit (x64)
• 300 MB of Available Hard Disk Space
• CD-ROM Drive or Internet Connection
• 800×600 SVGA/256 Color Display or better
• Internet Explorer Version 8 or better
Software
• Windows XP, Windows Vista, Windows 7, Windows 8.x,
Windows 10; Internet Explorer 6 or higher
• Office 2003 or higher (paste to Powerpoint Slide, Insert
Graphs into Word and other macros)

SigmaPlot 科學繪圖軟體
新的圖表功能
• 實心的箭頭
• 添加了一個滑鼠右鍵菜單命令,用於在頁面上粘貼複製的圖元
(箭頭、框等)
• 對圖表的常見操作是放大、修改然後縮小。在當前縮放級別和 100%
之間添加了一個切換按鈕 Ctrl+3。
• 數據採樣下拉列表現在顯示列中的最大行數
• 可以關閉滑鼠左鍵選擇的迷你工具欄
• 圖形頁面選項卡的格式組中添加了抗鋸齒按鈕
• 改進了顏色方案對話框的用戶界面
• 在一個圖上執行線性回歸時,“每個曲線”選項會自動打開
• 附加圖回歸統計
• 改進了統計分析後對結果圖的訪問——通過右鍵單擊統計報告或另一個
結果圖獲得
• 散點矩陣圖,用於顯示相關性等一些統計檢驗的結果,支持從之前的
10個變量增加到 40 個變量
• 現在可以通過右鍵單擊圖形或繪圖來獲得圖形屬性
• 將分析選項卡的圖形分析組中的線性回歸命令重命名為繪圖回
歸文本和特殊符號選項現在直接顯示在符號對話框中
• Graph Additions Group Name 已更改為 Manage Plots
• 現在可以從“創建結果圖”對話框中同時選擇多種結果圖類型
• 改進了所有結果圖的默認外觀
• 為圖形和圖形頁面添加了 TIFF 灰度導出選項
• 頁面模板按鈕已添加到圖表頁面功能區選項卡的格式組
新的工作表功能
• 工作表中的數據排序現在支持多個鍵列
• 變異係數和 90% 置信區間添加到列統計
• 格式化文本現在可用於統計分析
• 現在可以指定自定義列統計項目和順序
• 統計程序現在可以使用來自 4000 多個工作表列的數據
新的分析功能
• 添加了單向頻率表方法
• 未配對(又名 2 個獨立樣本)t 檢驗已得到增強,可提供選項來檢驗兩組• 總體均值的相等性,而無需假設方差相等(Welch 的 t 檢驗)
• Ctrl-A 現在選擇用戶定義轉換中的所有程序行
• 添加了更多非線性回歸應用示例,現在可以從“幫助”菜單訪問
• 現在可以從“幫助”菜單訪問的轉換示例的改進
• Transform Language中一些ape(自動參數估計)功能的改進
• 用於計算虛擬變量的組數已從 100 擴展到 1000
• 將統計表中標籤的最大字符長度從 30 增加到 255
• 錯誤消息和部分保存非線性回歸改進
• 用戶定義的變換和回歸對話框現在可以調整大小並且可以保存
• 改進了快速轉換對話框的用戶界面
新的雜項功能
• 現在支持 Unicode
• SigmaPlot 中提供自動更新功能,以獲取功能的最新更新
• 現在為新版本的 SigmaPlot 保留用戶設置
• 為不同類型的工作流程添加了新的功能區佈局
• 導出按鈕也在主按鈕上
• 用於導出任何圖形頁面選擇的新巨集方法
• 向主按鈕添加了“全部保存”命令
• 兩個使用索引數據作圖的新巨集指令
• 幫助中提供的示例數據集
• 確定工作表列長度的新巨集自動化方法
• 向主按鈕面板添加了文件導入和導入數據庫,以實現更直觀的訪問
• 現在可以從結果圖中提取數據
詳細v16規格請點我

3D Architect Home Designer Pro 建築設計軟體
適用於希望為其客戶設計建築項目的建築商的軟件。為規劃提交應用程序和符合建築法規的圖紙生成按比例縮放的準確房屋平面圖、立面圖、施工圖和 3D 可視化。
PTC Creo 高機能3D CAD軟體
PTC Creo 是3D產品設計的標準,這個業界頂尖的產能工具,不但有助於落實最佳設計工作模式,還能確實達到業界與公司標準。參數化的 3D CAD/CAM/CAE 整合解決方案讓您能以遠遠超越以往的速度進行設計工作,將創意和品質發揮到極致,最終達成建立高品質產品的目標。
modo
modo is the unique, artist-friendly 3D software that combines modeling, painting, animation and rendering in a fused workflow for designers and artists working in the areas of industrial design, architectural visualization, package design, game development, film and broadcast, education and scientific studies. When you buy modo, you can use it on both the PC and Mac as we license the software to you, not your computer.

